Processing and Visualizing Clickstream Data Using R
Learning Analytics and Knowledge Conference 2022
Pre-conference Tutorial
Examples of What You’ll Learn
By the end of the tutorial, you will understand how to use R to transform clickstream data into structured datasets that capture different aspects of students’ click behaviors. These datasets can then be used to inspect, visualize, and model student learning.
Some examples include the following:
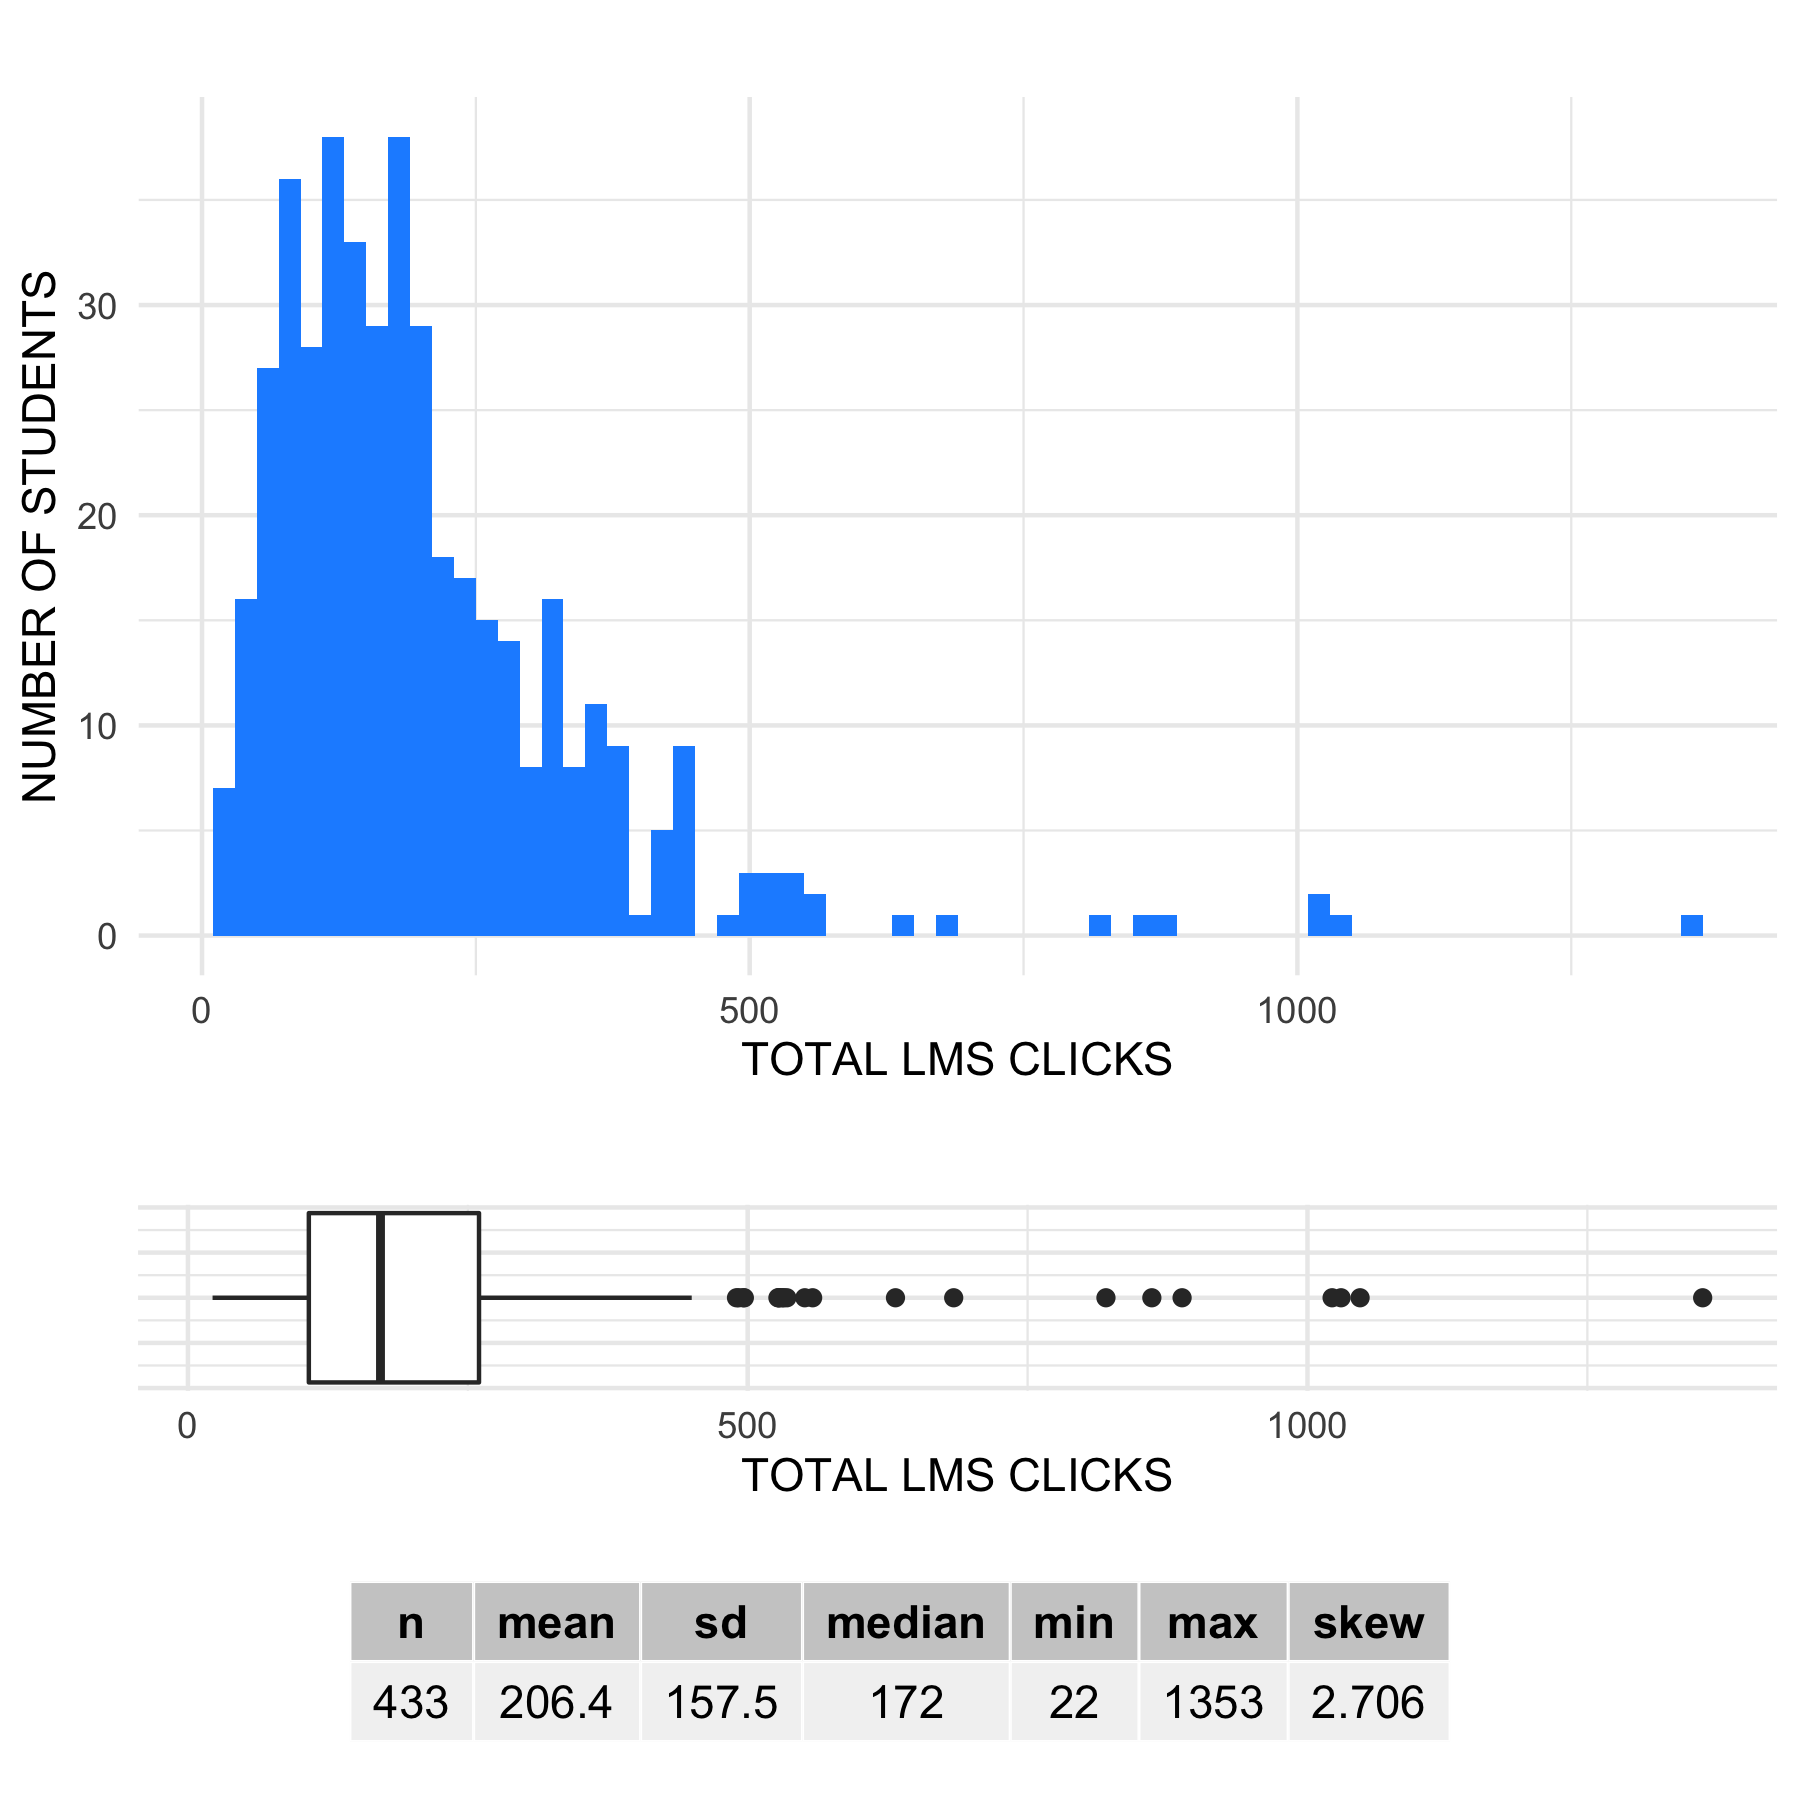
Generating Total Click Activity
The following plots and table provide descriptive information about students’ total number of clicks for the duration of the entire course. The histogram helps us understand the shape and spread of the total number of clicks, where the boxplot provides additional information about the interquartile ranges and observed outliers. More descriptive information is revealed in the summary table (e.g., mean, standard deviation, min, max).
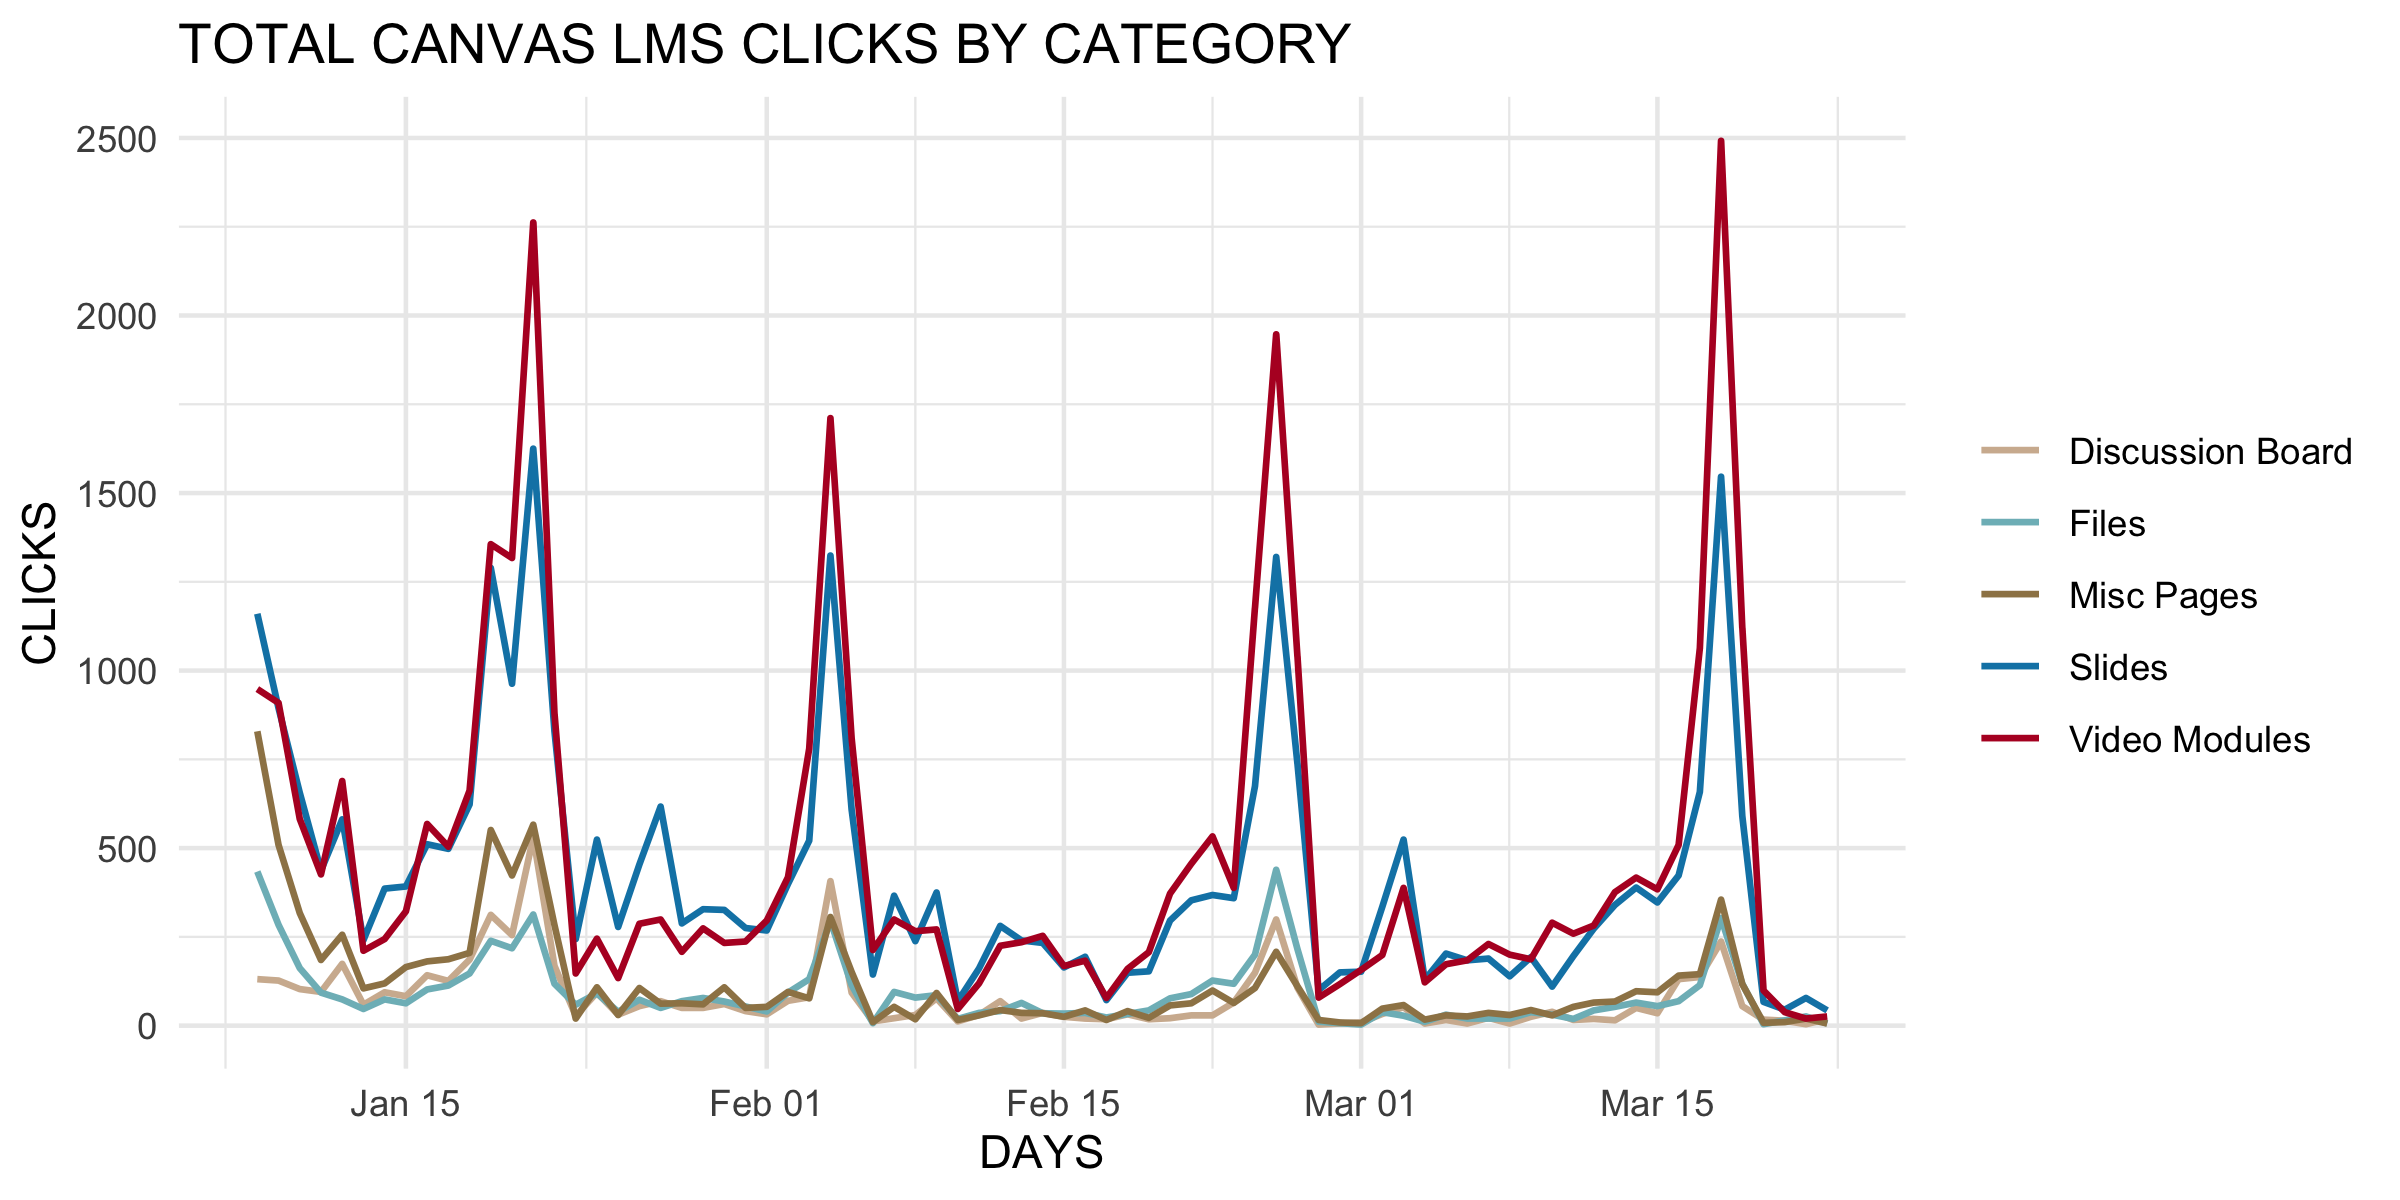
Generating Click Activity Per Day by Resource Type
In this line chart, the different colors represent the total number of the clicks pertaining to a specific course resource (e.g., discussion board, video modules). The x-axis represents the number of days in the course, while the y-axis represents the total number of clicks on the course’s LMS. As one can observe, student click activity peaks four times (during exam days), and much of this activity is focused on accessing the course’s videos and slides. This type of data visualization can be done at the course-level (as shown below), aggregate-level (the course average), group-level (e.g., STEM vs. non-STEM Majors) or individual-level.
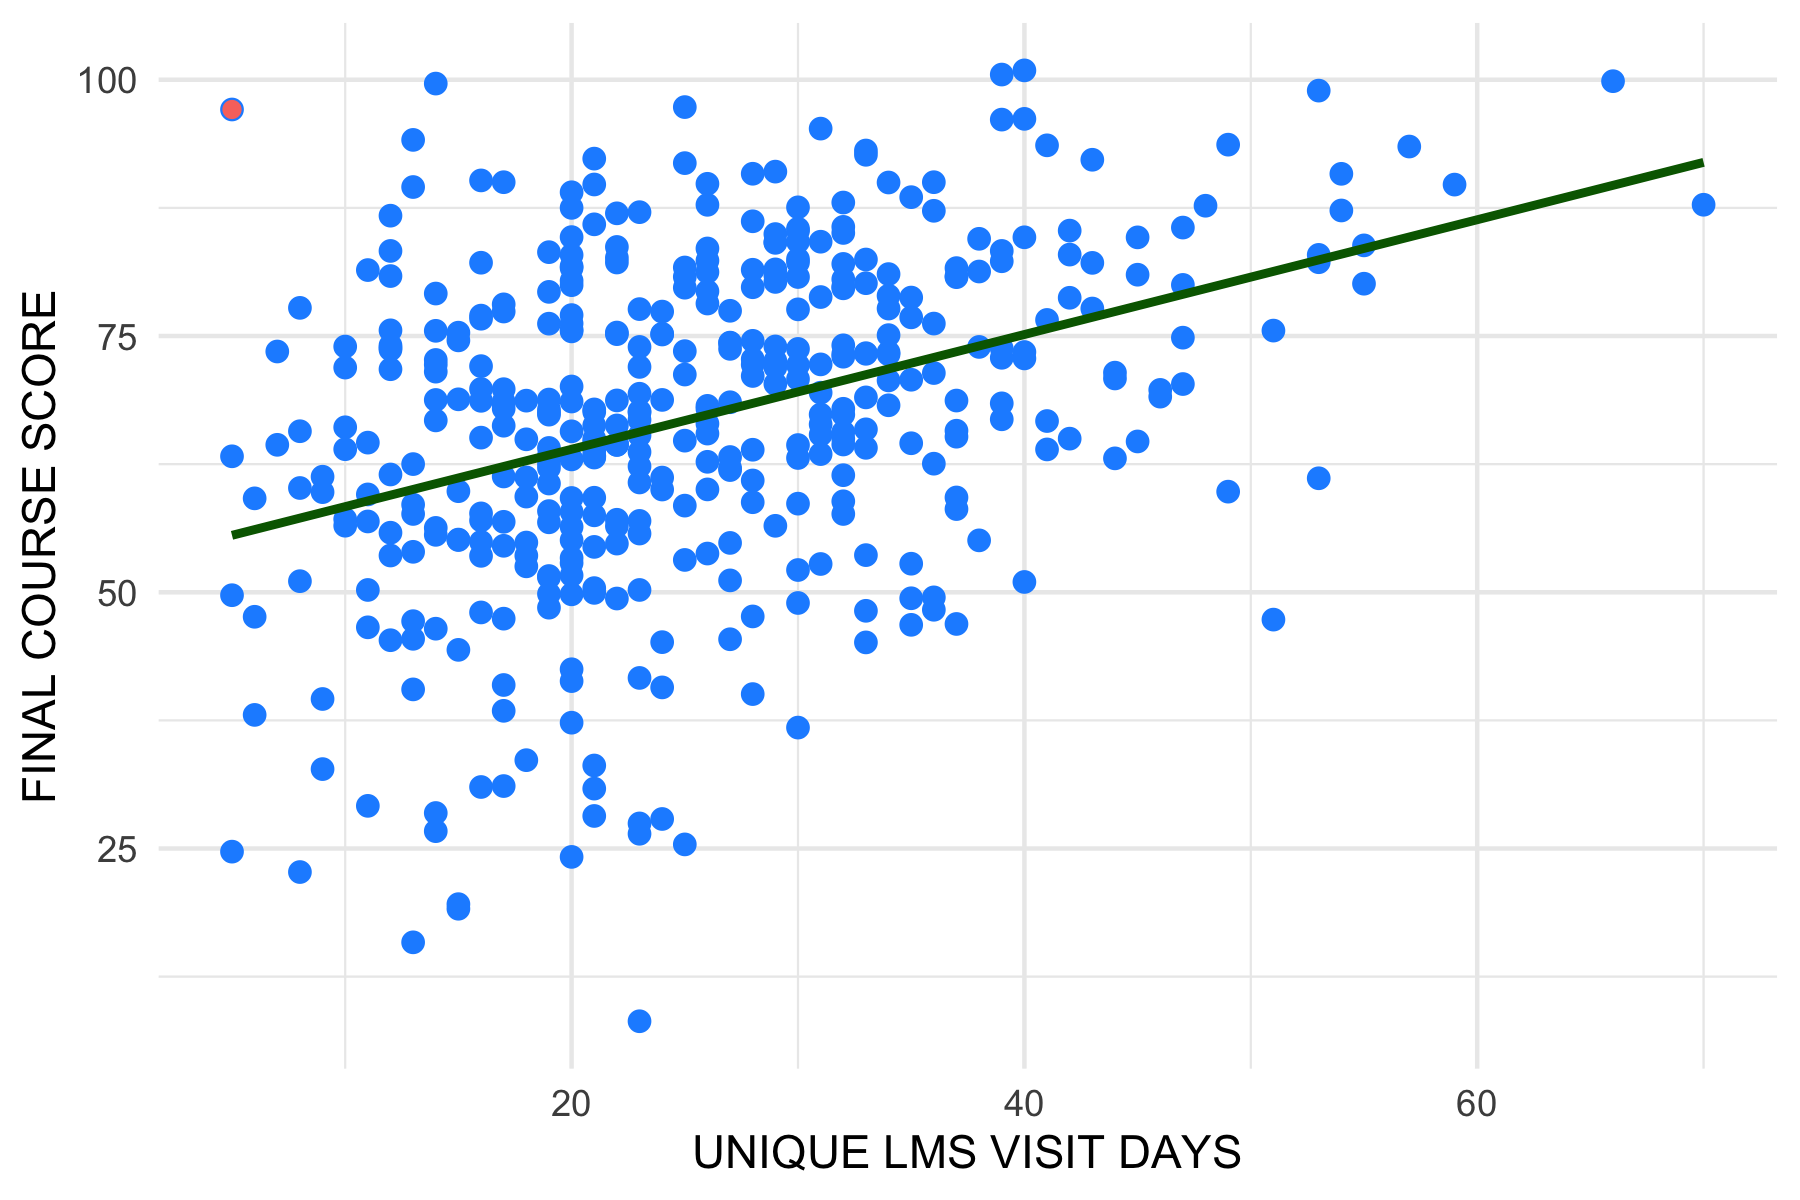
Generating Unique Visit Days and Final Course Score
This scatterplot shows the number of unique days students visited the course’s LMS (displayed in the x-axis) and its relationship to their final course score. We see that visiting the course’s LMS often over the length of the course is positively associated with final course scores. Looking closely at the data also reveals that a single student had very few visit days in the course’s LMS but received one of the highest course scores (red point), which is unlikely to occur and warrants inspecting.🧐